
Climate and Energy
Devens is a unique community with bold goals. As a thriving center of industry and innovation, Devens has taken action to ensure that it grows while taking care of the environment. Devens may be small, but it has big goals that are right in line with the Paris Climate Agreement and the State of Massachusetts.
GHG Emissions
2015 Greenhouse Gas Inventory
Planning for resilience in the face of climate change requires not just considering climate threats but also the contribution we make to driving additional change.
The first step is to account for all the greenhouse gases (GHGs) that the Devens community is responsible for through a GHG inventory. To support this plan, Devens conducted an inventory for calendar year 2015, which had the most complete data available.
In total, activities by residents, visitors, and workers in Devens resulted in 96,054 metric tons of CO2e. It would take 1.5 million tree seedlings growing for 10 years to offset our emissions from a single year.
Devens is a unique community with a unique GHG profile. Whereas other communities have a more even balance of energy use and emissions across sectors, Devens profile reflects the mix of activities that happen here today, which is dominated by building energy.
While this creates significant opportunities to reduce emissions from industry today, it will be important to watch growth in transportation, waste, and energy use in other sectors as the community continues to develop.
GHG Emissions
Economic Carbon Intensity
Carbon intensity measured in metric tons of carbon dioxide equivalent (MTCO2e) per million dollars of GDP (Million $ GDP) is a performance indicator that can tell us about efficiency in addition to total emissions. As Devens grows, the denominator of this value will grow. Whether GHGs grow at the same rate or shrink will be a key metric for demonstrating how well Devens is transforming to a low carbon community.
Greenhouse gas emissions from Devens' municipal operations are similar to other local governments, with buildings and facilities as the largest contributor followed by wastewater, fleet vehicles, potable water pumping, employee commute, and streetlights.
In Devens, the 2nd largest source is from wastewater treatment, which includes both the energy needed to move large volumes of water but also the emissions from the wastewater treatment process itself.
Energy use is generally the largest source of GHGs and it is used for a variety of different purposes across our municipal services. Energy to run and heat buildings, light our streets, pump water and wastewater, and to power our vehicles all contribute to the GHGs emitted from our municipal operations.
Just as at the community scale, the greatest opportunity to reduce GHGs from Devens' municipal operations is by minimizing energy use, but also shifting its energy to electricity and renewable sources. More electric vehicles will shift energy away from gasoline and diesel, and efficiency improvements can minimize gas use for heating.
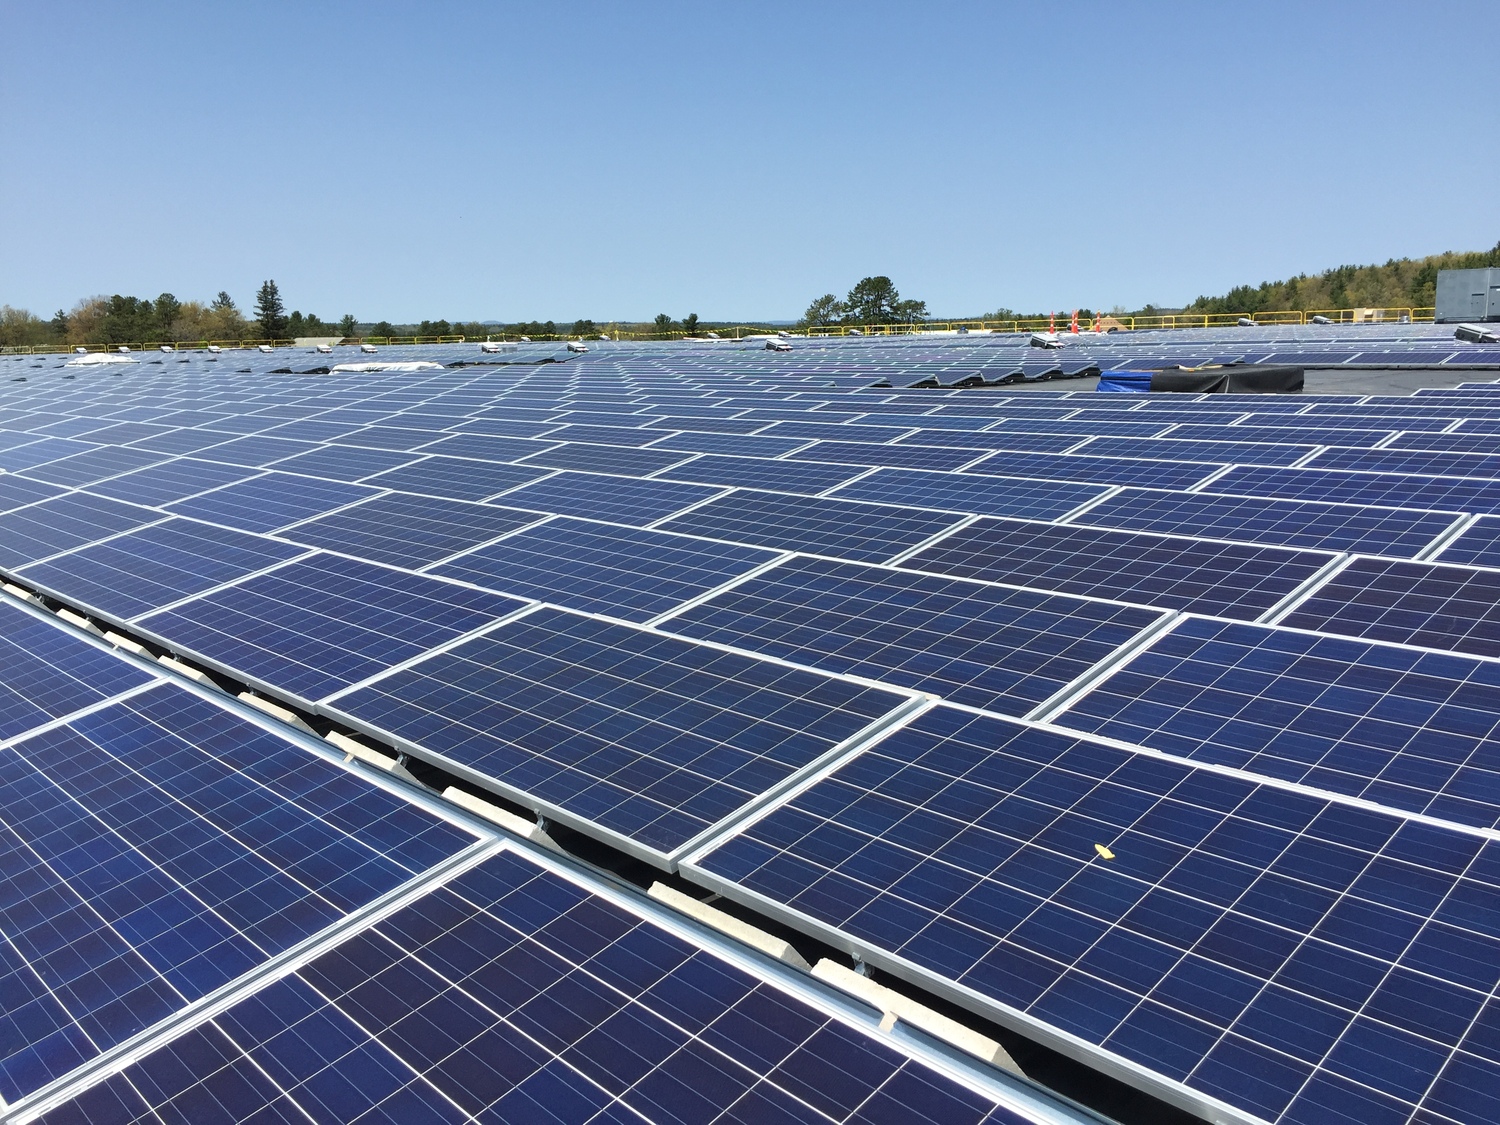
Renewable Energy Development
Greening the Grid
Devens has a green advantage because it has control over its energy mix through its municipal utility. Devens sources its electricity supply to obtain clean energy while ensuring low costs to residents and businesses.
Currently 10% of Devens' supply mix comes from renewable sources compared to the 9% average for the electricity grid in New England as a whole. What is exceptional for Devens is that a substantial portion of the renewable energy mix comes from over 10 MW of solar energy resources developed in and around the community.